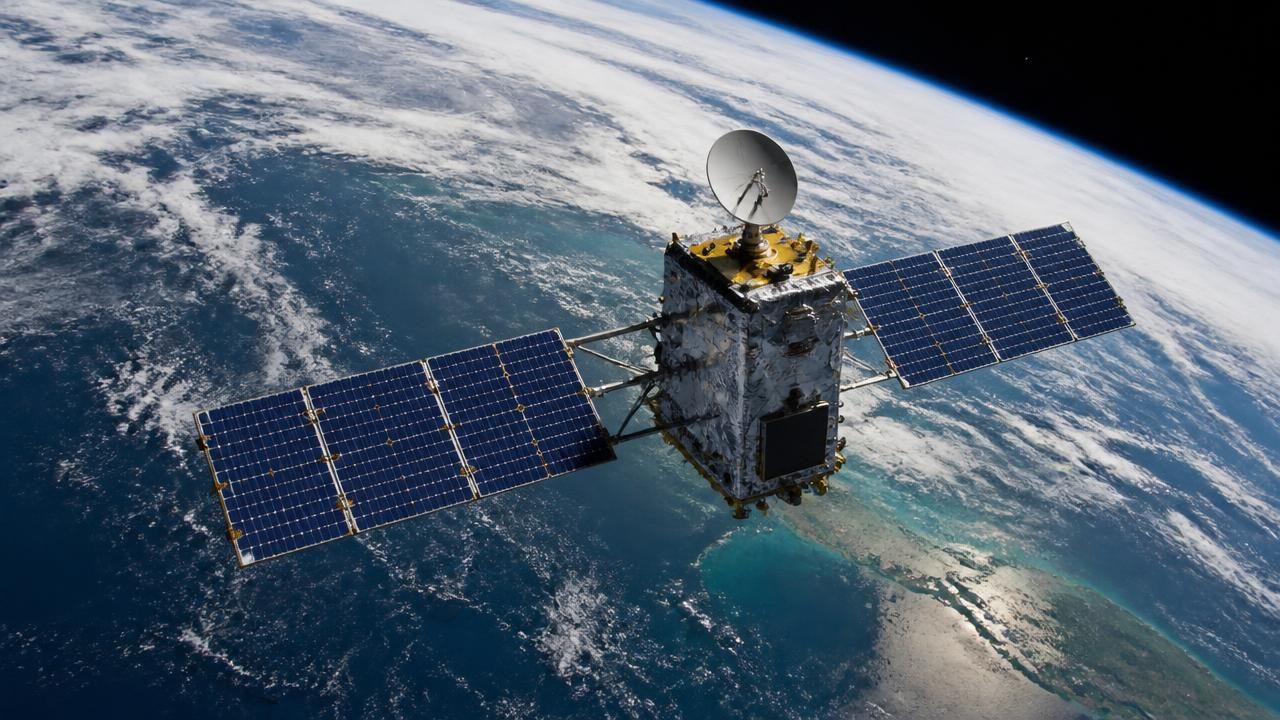
A climate phenomenon that NASA describes as "rarer than a solar eclipse and more powerful than any single storm system" is taking shape across the equatorial Pacific, and an armada of Earth-observing satellites is watching it happen in real time. As of October, the National Oceanic and Atmospheric Administration (NOAA) assessed an 83% chance that the strongest El Niño since 1950 is currently unfolding — a projection that has ricocheted through newsrooms under a far blunter label: "Godzilla."
The story has arrived in public view through strikingly different lenses. NASA's own account is measured and visual, built around three ocean data products rendered by the agency's Scientific Visualization Studio. Aggregators and syndicated headlines have been considerably more dramatic, promising "the ominous pattern leading up to a super El Niño, revealed by NASA satellites" and a "75% chance of major winter weather changes ahead." Between those two framings lies the real story: a planet-scale redistribution of heat that scientists can now measure from orbit, and whose consequences will be felt on farms, in fire zones and along coastlines for months.
A Pacific Ocean in Flux
El Niño is a natural climate pattern that emerges roughly every two to seven years, marked by warmer-than-normal water temperatures across parts of the equatorial Pacific. What follows is a cascade: trade winds weaken or reverse, ocean heat that normally pools in the western Pacific sloshes eastward, rainfall patterns scramble across entire continents, and the sea surface itself rises in some places while falling in others.
NASA's visualization captures that upheaval by layering three measurements over the same months in 2025 and 2026 — sea surface temperature anomaly, apparent visible wavelength ocean color, and sea surface height anomaly. In the sea-height maps, lower-than-normal conditions appear in blue and higher areas in orange and red. The comparison is deliberately stark: 2025 was a weak La Niña year, the cool-phase mirror image of El Niño, making the two years a natural before-and-after experiment.
"A phenomenon rarer than a solar eclipse and more powerful than any single storm system is unfolding this fall, and NASA is tracking it closely."
How Scientists See It From Orbit
The satellites do more than take pictures. Sea surface temperature anomalies reveal where the ocean is running hotter than its long-term average — the engine of the whole system. Sea surface height anomaly, measured by satellite altimetry, exposes the thermal expansion of water as it warms, giving researchers a three-dimensional sense of how much heat has been loaded into the upper ocean. Apparent visible wavelength, meanwhile, tracks ocean color, which shifts with the plankton populations that form the base of the marine food web.
Why the numbers don't match
The apparent discrepancy between NOAA's 83% figure and the 75% cited in syndicated coverage is less a contradiction than a difference in what is being measured. One number speaks to the probability that the event ranks among the strongest on record; the other speaks to the likelihood of consequential winter weather. Both point in the same direction, and both carry wide error bars — a reminder that seasonal forecasting is a game of probabilities, not prophecies.
'Godzilla' and the Language of Risk
The nickname is not new. It was applied to the powerful 1997–98 El Niño and again to the 2015–16 event, and it has become shorthand for the upper tier of the historical record. Its revival in 2026 reflects a genuine signal — ocean heat content in the equatorial Pacific running well above normal — but also a media economy that rewards superlatives. NASA's institutional voice, by contrast, emphasizes the mechanics: trade winds flipping, heat redistributing, rain belts migrating.
The gap matters. Sensational framing can mobilize preparedness, but it can also distort public understanding of a phenomenon whose impacts are regional, seasonal and uneven. An El Niño that ranks in the top tier globally may deliver near-normal conditions in any given city.
What It Means on the Ground
NASA notes that farmers, firefighters and coastal communities are already experiencing effects, each in different ways. Historically, strong El Niño events have produced:
- Drought and wildfire risk across Indonesia, eastern Australia and parts of southern Africa, as the rain-bearing convergence zone shifts east.
- Flooding and landslides along the coasts of Peru and Ecuador, where warm water fuels heavy convection.
- Anomalous winter storms in California and the southwestern United States, delivered by an enhanced subtropical jet stream.
- Suppressed Atlantic hurricane activity, as increased wind shear tears storms apart before they organize.
- Widespread coral bleaching, as prolonged marine heat stress pushes reefs past their thermal limits.
- Disrupted fisheries, as plankton and the species that feed on them migrate away from their usual grounds.
What to Watch Next
The coming months will test the forecasts against reality. Scientists will be watching whether the warm anomaly persists through the Northern Hemisphere winter — the period when El Niño's atmospheric fingerprint is strongest — and whether it strengthens or decays into spring. Satellite records stretching back decades, including the altimetry that makes NASA's 2025-versus-2026 comparison possible, give researchers a benchmark that simply did not exist during the great El Niño of 1982–83.
For all the "Godzilla" headlines, the deeper story is one of improved visibility. A phenomenon once detectable only through scattered ship reports and coastal observations is now monitored continuously from space, its every pulse of heat mapped in color. The question is no longer whether scientists can see the next great El Niño coming — it is what the world chooses to do with the warning.