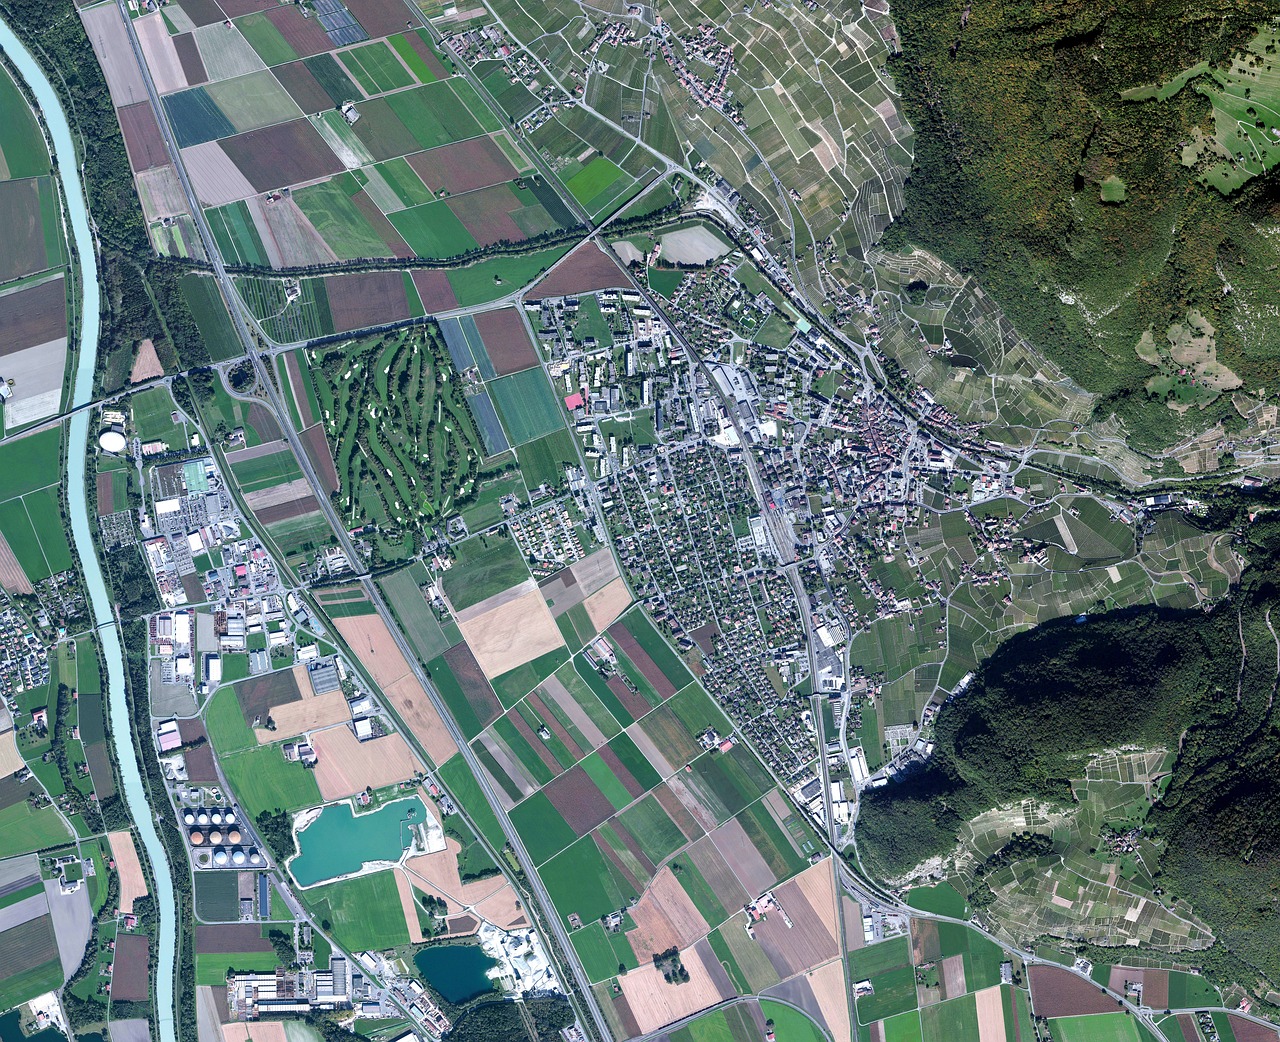
As wildfires rage across Europe, a quiet revolution in satellite data accessibility is giving everyone—from firefighting agencies to concerned citizens—a sharper view of the flames. The Copernicus Browser, the European Union's free and open satellite imagery service, has added a dedicated 'wildfires' visualization layer for Sentinel-2 data that went live on 4 August. This new tool makes it possible to see active fires, burned vegetation, and scorched landscapes in near-real-time, at resolutions as fine as 10 meters per pixel.
The layer, built on a visualization script originally developed nearly a decade ago, uses multi-spectral imaging from the three Sentinel-2 satellites to distinguish between burning vegetation, fresh burn scars, and healthy landscapes. According to Ars Technica, anyone clicking on the 'wildfires' layer while looking at a wildfire location can see active fires in white or yellow, burning vegetation in red, and burned landscapes in dark brown or black. This is a significant upgrade from the 10 default visualization layers that previously focused mainly on vegetation health, water bodies, and true-color imagery.
A Season of Records and Firestorms
The timing of the new satellite tool is far from accidental. Europe is on track for its worst wildfire season ever recorded, according to satellite data highlighted by MSN and the Copernicus Emergency Management Service. Countries across the Mediterranean basin, including Greece, Italy, Spain, and Portugal, have seen thousands of square kilometers of land burned. In Greece alone, wildfires in August forced mass evacuations and triggered an international response.
The intensity of these fires has reached a level that scientists describe as almost unprecedented. ScienceDaily reported that some European wildfires became so intense they created their own storm. This phenomenon, known as a pyrocumulonimbus cloud, occurs when extreme heat from a fire rapidly lifts moisture into the atmosphere, forming thunderheads that can spawn lightning, high winds, and even fire tornadoes. Such fire-induced storms can cause fires to spread unpredictably, making them a nightmare for firefighters and a clear sign of how climate change is amplifying fire weather conditions across the continent.
EUMETSAT's Complementary Role
While the Copernicus Sentinel-2 satellites offer high-resolution images with frequent passes, they are not the only eyes in the sky. EUMETSAT, the European Organisation for the Exploitation of Meteorological Satellites, provides complementary data from geostationary and polar-orbiting satellites. These platforms monitor fires at lower spatial resolution but with much higher temporal frequency, allowing for rapid detection and tracking of fire behavior, smoke plumes, and emission transport. EUMETSAT's user portal emphasizes that satellite data are essential for fire management, offering tools for operational fire monitoring, risk assessment, and post-fire recovery. Together, these systems form a robust Earth observation network that helps emergency services and scientists respond to the growing threat.
Tracking and Investigating the Crisis
For the general public, the Copernicus Browser is not the only accessible resource. The New York Times has assembled interactive maps tracking wildfires across Europe, using data from the European Union's satellite programs and NASA fire information systems. These maps provide a broad visual overview of the worst-hit regions, allowing readers to grasp the scale of destruction—from the flames consuming Greek olive groves to the smoke drifting across the Adriatic Sea.
Journalists are also turning to open-source intelligence (OSINT) tools to investigate the environmental and health impacts of these fires. A recent briefing from the International Journalists' Network (IJNet) highlighted essential OSINT resources for reporters investigating air pollution, many of which are directly applicable to wildfire smoke. These tools include satellite-derived aerosol optical depth measurements, ground-based air quality monitors, and publicly available data from services like the Copernicus Atmosphere Monitoring Service. By combining these data sources, journalists can map the movement of smoke plumes, estimate exposure in populated areas, and hold authorities accountable for air quality warnings.
Why It Matters
The democratization of satellite data is more than a technical convenience; it is a vital adaptation tool in an era of intensifying extreme events. Wildfires in Europe have historically been seasonal and manageable, but a combination of prolonged drought, record heatwaves, and land-use changes has turned the region into a tinderbox. The European Union's Earth observation programs—once created for environmental monitoring—have become frontline instruments of crisis response and public awareness.
Accessible visualization layers enable local authorities to spot fires early, but they also empower citizens to understand the risks around them. For tourists, hikers, and rural communities, the ability to see an active fire from space can mean the difference between fleeing early and being caught off guard. The Copernicus Browser's new 'wildfires' layer supports multilingual and provides a seamless interface for anyone to switch from a holiday map to a disaster dashboard.
Looking ahead, experts argue that continued investment in satellite infrastructure is essential. The Sentinel-2 mission is just one piece of a broader European space strategy, with future satellites promising even higher resolution and more frequent revisits. In parallel, machine-learning algorithms are beginning to automatically detect and forecast fire behavior from satellite feeds, offering early warning systems that could cut response times from hours to minutes.
But technology alone cannot solve the underlying issues. The record-breaking fire season across Europe is a clear signal that climate policies must address the root causes of warmer, drier conditions. As the Continent wrestles with this new reality, the combination of robust satellite data, political will, and public engagement will be decisive. The flames may be visible from space, but so is the path forward.
Anyone clicking on this layer while looking at a wildfire location can see active fires in white or yellow, burning vegetation in red, and burned landscapes in dark brown or black.
For now, the new 'wildfires' visualization layer is already being used by first responders, environmental agencies, and concerned citizens across Europe. It is a small but vital piece of the puzzle—one that proves that open data can make a transparent and tangible difference in the fight against climate change.
- Copernicus Sentinel-2 provides 10-meter resolution imagery for wildfire monitoring.
- EUMETSAT's geostationary satellites offer rapid detection of active fires.
- Pyrocumulonimbus events are creating their own weather and posing new challenges.
- Journalists are using OSINT tools to track air pollution from wildfire smoke.
- Europe is on track for its worst wildfire season on record.